How to Measure LinkedIn Carousel Performance
Measure a LinkedIn carousel by its job: one primary metric per post, member and Page metrics kept apart, a 30-day tracker and benchmarks used as context.
To measure LinkedIn carousel performance, start with the job of the post. Use impressions and members reached for distribution, saves and sends for reuse, comments for conversation, profile activity for interest, and tracked business outcomes for conversion.
LinkedIn reports different metrics for member posts and LinkedIn Page posts. A member's post analytics include impressions, members reached, reactions, comments, reposts, saves, sends, profile viewers, followers gained, and eligible link visits. Page content analytics include impressions, members reached, clicks, reactions, comments, reposts, and an engagement rate based on interactions per impression.
Match the metric to the job
| Carousel goal | Primary metric | Useful supporting signal |
|---|---|---|
| Reach the right audience | Members reached | Impressions, audience demographics when available |
| Create a reusable resource | Saves | Sends, comments that mention future use |
| Start a conversation | Relevant comments | Sends, reposts |
| Build authority | Profile viewers or Page viewers | Followers gained, repeat commenters |
| Drive action | Tracked link visits or manual conversions | Profile activity, qualified DMs |
| Test a format | Change from your own comparable baseline | Hook, topic, slide count, and CTA notes |
Don't make every number a primary metric. A checklist carousel may be judged by saves, while a case-study carousel may be judged by profile activity or qualified conversations.
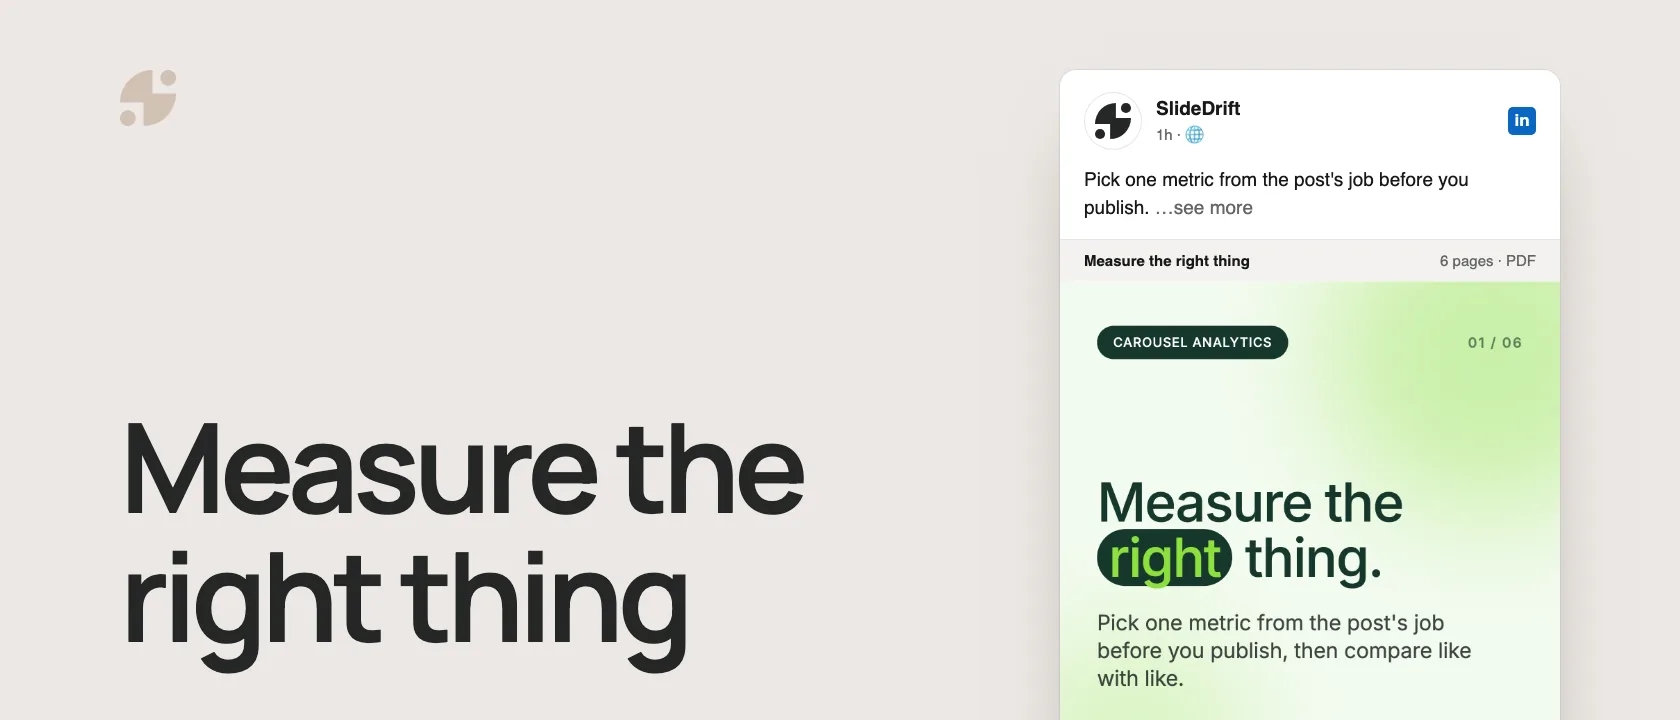
Here's the method as a carousel, made in SlideDrift.
SlideDriftCreate your ownCarousel transcriptShowHide


- 01Measure the right thing. Pick one metric from the post's job before you publish, then compare like with like.
- 02Every post gets one metric. Saves for a checklist, comments for an opinion, profile views for expertise, tracked actions for an offer. Everything at once: no decision. One primary metric: a clear test.
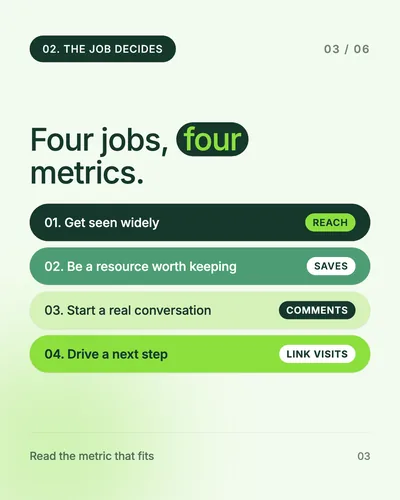
- 03Four jobs, four metrics. Get seen widely: reach. Be a resource worth keeping: saves. Start a real conversation: comments. Drive a next step: link visits.
- 04Pages and profiles measure differently. Profile posts show saves and sends. Page posts show clicks and an engagement rate. Keep the two apart and compare like with like.
- 057.00%. Average document engagement in a 2025 benchmark: Socialinsider's figure for business Pages, by impressions. Context, not a pass mark: compare against your own recent posts.
- 06Likes aren't the metric. Goals are. Write the post's job down before you publish, check the same metric at the same checkpoint, and change one thing next time.
Use the right LinkedIn analytics surface
Member post and Page post metrics are not identical
| Analytics surface | Metrics to record | Important boundary |
|---|---|---|
| Member post | Impressions, members reached, reactions, comments, reposts, saves, sends, profile viewers, followers gained, and eligible link visits | LinkedIn describes these values as estimates, and your own activity can be counted. |
| LinkedIn Page post | Impressions, members reached, clicks, reactions, comments, reposts, and engagement rate | LinkedIn defines Page engagement rate as interactions divided by impressions; interactions include clicks, reactions, comments, and shares. |
| Business tracking | Qualified DMs, signups, booked calls, demos, or another outcome tied to the post | Record these outside LinkedIn and keep the attribution rule consistent. |
Do not enter zero when a metric is unavailable. Leave the cell blank so a missing metric does not look like a measured failure.
Build a 30-day carousel measurement tracker
Use one row per carousel. Record the result at the same checkpoint for every post, such as seven full days after publication. A fixed checkpoint will not capture every later interaction, but it makes comparisons less distorted.
Reusable tracker
Thirty-day carousel measurement worksheet
Create these columns in a spreadsheet:
- Post: publication date, post URL, member or Page, and measurement checkpoint.
- Creative: topic, audience, carousel format, hook, slide count, and CTA.
- Goal: one primary job and one primary metric chosen before publication.
- Distribution: impressions and members reached.
- Response: reactions, relevant comments, reposts, saves, sends, and clicks when the analytics surface provides them.
- Interest: profile or Page viewers and followers gained when available.
- Outcome: qualified DMs, signups, calls, demos, or another manually tracked result.
- Decision: keep, change, or stop one element in the next comparable carousel.
Use these optional comparison formulas only when both inputs exist:
- Saves per 1,000 impressions = saves ÷ impressions × 1,000.
- Sends per 1,000 impressions = sends ÷ impressions × 1,000.
- Profile viewers per 1,000 impressions = profile viewers ÷ impressions × 1,000.
- Reach frequency = impressions ÷ members reached.
These are custom comparison rates, not LinkedIn's official performance scores. Label them clearly and never replace a missing input with zero.
At the end of 30 days, group posts by comparable format and goal. Compare checklists with checklists, case studies with case studies, and member posts with member posts.
Read the metric hierarchy in order
1. Distribution
Impressions count how often the post was shown. Members reached estimates the distinct members and Pages that saw it. Use both: impressions alone cannot tell you how many distinct people saw the carousel.
2. Response
Reactions, comments, reposts, saves, and sends record different actions. A save can support a reuse goal. A relevant comment can support a conversation goal. Neither action proves that the carousel was accurate or commercially effective.
3. Interest
Profile viewers and followers gained can show that a member post created interest beyond the post itself. For a Page, use the Page post and Page analytics available to your admins.
4. Business outcome
Track the action the carousel was meant to support: a qualified message, signup, booked call, demo request, or another defined conversion. Keep the attribution window and qualification rule consistent across posts.
Diagnose patterns without overclaiming
| Pattern | Plausible reading | Next test |
|---|---|---|
| High impressions, low primary-metric response | Distribution worked better than the content's intended job | Keep the topic and test a more specific promise or stronger proof |
| Low impressions, strong saves or sends per 1,000 | The post may be useful to a narrower audience | Keep the resource and test a clearer first slide |
| Relevant comments, few saves | The topic creates discussion more than later reuse | Keep it conversation-led or add a reusable recap |
| Profile activity, no tracked conversion | Interest increased but the next step may be unclear | Align the CTA and profile destination with the carousel promise |
| Strong public engagement, no qualified outcome | The post may be broadly appealing but commercially weak | Narrow the audience or choose a business-relevant topic |
These patterns are hypotheses. Change one variable in the next comparable carousel so the result can teach you something.
Use external benchmarks carefully
Socialinsider's 2026 report analyzed 1.3 million posts from 16,645 LinkedIn business Pages. It reports a 7.00% average engagement rate by impressions for native documents in its 2025 dataset and a 6.60% quarterly figure for Q2 2026. That's useful Page-level context, not a pass/fail threshold for an individual member or Page.
Your first comparison should be your own recent posts with the same account type, goal, audience, and checkpoint.
Keep the creative test controlled
SlideDrift can help you reuse a stable visual system while changing the variable you want to test. Keep the template and brand kit consistent when comparing hooks or topics. Keep the topic and structure consistent when comparing visual directions.
Don't conclude that a template “won” when the topic, hook, posting time, audience and CTA all changed with it.
Make your next test carousel
Paste your notes or a link, keep the design fixed, and change only the thing you want to test.


Brief for this carousel
Make a 6-slide LinkedIn carousel on measuring LinkedIn carousel performance. A cover (measure the right thing), then: give every post one primary metric, match four jobs to four metrics (reach, saves, comments, link visits), keep profile and Page analytics apart, use benchmarks as context rather than a pass mark, and end with: likes aren't the metric, goals are.
A practical review sequence
Review one month of carousel results
- Remove rows with missing checkpoints or incomparable analytics surfaces.
- Group the remaining posts by goal and carousel format.
- Find the strongest and weakest result for the chosen primary metric.
- Read the comments and business outcomes before declaring a winner.
- Write one difference you can test without changing everything else.
- Carry that single change into the next comparable carousel.
What not to measure in isolation
- Likes without the post's goal.
- Impressions without members reached.
- A Page engagement rate against a member post's custom rate.
- A broad beginner topic against a niche expert topic.
- One carousel against a benchmark built from thousands of business Pages.
- DMs without a consistent definition of “qualified.”
Related reading
Use the saveability test when saves are the primary goal. Review the carousel CTA examples when profile activity is not turning into a clear next step. If your sample is too small, choose a sustainable test cadence with the carousel posting-frequency worksheet.
FAQ
What metrics should I track for LinkedIn carousels?
Choose metrics from the post's goal. Track impressions and members reached for distribution; saves and sends for reuse; relevant comments for conversation; profile activity for interest; and qualified business outcomes for conversion.
Can I see saves on LinkedIn posts?
LinkedIn member post analytics includes saves and sends. LinkedIn Page content analytics lists a different metric set, so record only what appears in the analytics surface for the account that published the carousel.
What is a good LinkedIn carousel engagement rate?
There is no universal pass mark. External benchmarks can provide Page-level context, but your most useful baseline is a set of comparable posts from the same account, goal, audience, and measurement checkpoint.
How long should I wait before comparing carousel results?
Choose one fixed checkpoint and use it for every post in the test. Seven days is a practical editorial checkpoint for a 30-day worksheet, but it is not a LinkedIn rule and later interactions can still occur.